System resources are always limited, no matter what type of computer or server you're using. You never seem to have enough RAM, CPU threads, or disk I/O. High level tools like top, htop,sar, iostat, or vmstat do help, but they only give you the 10,000 foot overview of resource usage. They don't allow you to see what part of which program or process is eating up too much RAM or which part is creating race conditions on lock files.
A much more powerful took is "Atop", a powerful monitor program that allows you to see system-level counters concerning utilization of CPU and memory/swap, as well as see disk I/O and network utilization counters at the system level -- in real time or historically. It also allows you to store raw counters in a file for long-term analysis on system levels and process levels, as well as seeing resource consumption for each thread within a process of a multi-processor program.
Sounds exciting? Read on.
Installation and basic use
Believe it or not, this gem has been sitting in most distro repositories for quite some time. Installation is as simple as opening your package manager and selecting it for installation.
From the command line, you can type yum install atop (for RedHat lineage distros) or sudo apt-get install atop (for Debian lineage distros). You can also download Atop from its official site.
Once installed, open a terminal and change to the root user. Although Atop can be run as a user, you'll get more information from it when run as root.
Once run, a screen like figure 1 will appear.
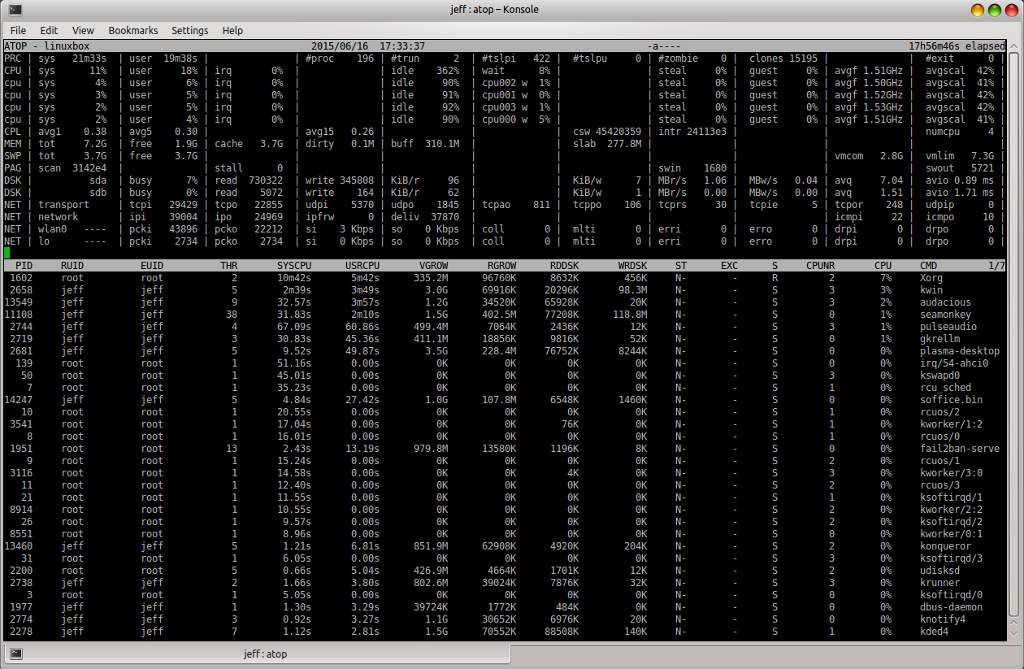
The first thing that you'll notice is that there is a lot of information on that one screen. The second thing you should notice is that the window is resizeable. This feature allows you to see what's in each column instead of it being cut off, with no way to know what's there. Enlarging the screen during some operations will add additional columns with even more information in them.
The screen is divided into two broad sections, System level (top section and Process level (bottom section).
The system level section
In the top section, each line is a resource type (first column): PRC (process level totals), CPU, CPL (CPU load information), MEM, SWP (swap occupation and overcommit info), PAG (paging frequency), LVM/MDD/DSK (logical volume/multiple device/disk utilization), NET. If you have more than one CPU or core, you will have one main row called CPU (in capitals) and then one extra row per core called cpu (small letters).
The process level section
The process level section will show something similar to what you are used to with the top program. Note that the output is also nicely paginated (^F to go forward, ^B to go back).
You can control the output of the atop command from your keyboard. Remember that you can always make the screen wider to show more details.
mfor memory related output;dfor disk-related output;nfor network related output;vfor various process characteristics;cfor the command line of the process.
For advances users
Here are some advanced uses of Atop.
Thread information
Developers writing multi-core, multi-thread programs can press the s key while their program is running to show specific scheduling information about the main thread of each process. For example, scheduling policy, nice value, priority, real time priority and CPU number (current or last used) and state.
Furthermore it shows how many threads within this process are in the state 'running' (busy on CPU or waiting in the run queue), 'interruptible sleeping' or 'non-interruptible sleeping'. The total number of threads can be determined by accumulating these three values (columns TRUN, TSLPI and TSLPU).
Disk activity information
Trying to debug a program where your disk writes aren't getting written to disk is very frustrating. You may have a function calling another function, calling another function and can't figure out why nothing is getting written to disk. Atop to the rescue. Press the d key. The lines with label LVM (logical volumes) and DSK (underlying physical disks) shows the disk-activity on system-level.
On process-level the disk activity is shown as the amount of data transferred by reads (column RDDSK) and writes (column WRDSK). Usually the written data is stored in the in-memory page cache before it is physically written to disk. When the data is written to the page cache but destroyed before physically written to disk, that amount is reported as canceled (column WCANCL).
Make the window larger and columns are added for the system level statistics, like the number of Kb transferred per read and write request, the total throughput per second for reading and writing, and the average number of requests in the request-queue of the disk driver.
Now you can easily see exactly what is happening (if anything) at the system-level disk resource. You can see that something cancelled your write request before it got written to disk. Unfortunately, It won't tell you which line in your program is causing this.
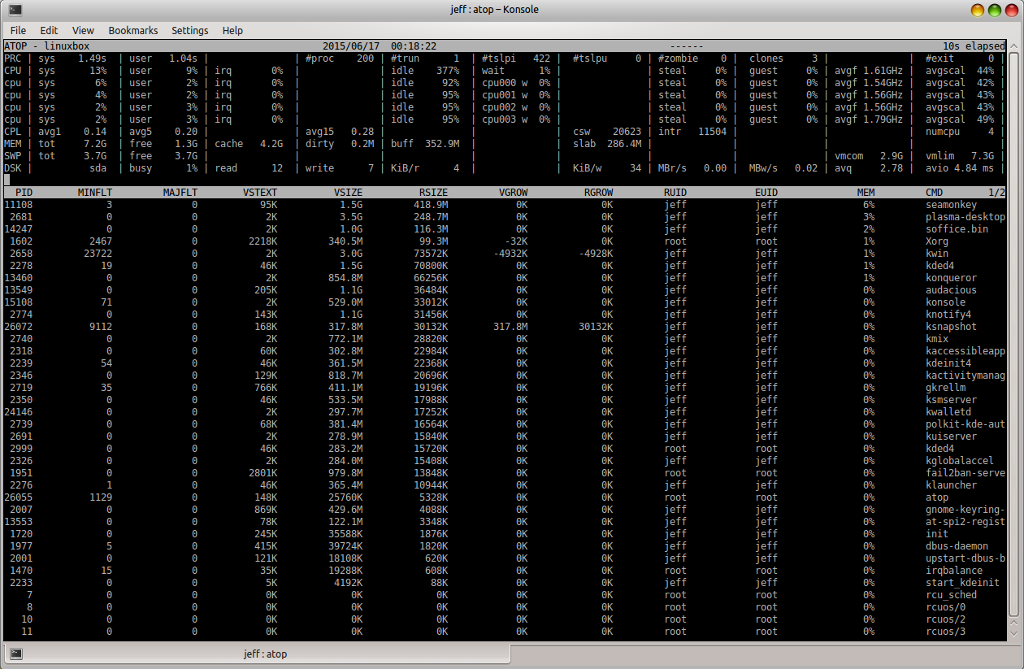
Memory leaks
When developing a program, memory leaks are extremely hard to find. Many programs have had memory leaks through many versions, with developers scratching their heads looking for them. Atop lets you watch memory dynamically, logging all data by time and threads, allowing you to easily spot memory leaks. Figure 2 displays every type of memory usage by any and all programs and processes. You can watch memory usage grow and shrink over time.
Historical information
Sysadmins are going to love this one. Press the 'u' key. This screen shows in the right most column which users are active (or have been active during the last interval) and in the left most column how many processes each user runs/ran. The columns in between show the accumulated CPU consumption, the accumulated virtual and resident memory consumption (notice that the shared parts are accounted for every process, so this is far too high), the accumulated transferred data from/to disk and (only in case the netatop module is active) the accumulated network transfers.
When you come into the office in the morning you can find out why your ssh/vnc session from home was so slow last night. Someone was running some pretty heavy programs during the night. Can you say Bitcoin Mining?
Background running
Atop runs as a daemon. If you don't want it running, simply kill it. Atop also creates log files in the standard log file location for your distro. Historical data is stored in the log files. The log files are compressed and must be read by atop. To view a log fil, type 'atop -r /full/path/to/atop/log/file.
Once you open a log file (eg. atop -r /var/log/atop/atop_20150617), use t to go forward in 10 minute intervals and T to go back. You can analyze specific times by pressing b then entering the time.
Conclusions
I've only touched the tip of the iceberg as far as functionality of atop is concerned. You can start atop with command line parameters that will allow you to do so much more. Go to their website and start reading the documentation. Hopefully, I've piqued your curiosity enough for you to explore this great utility further.